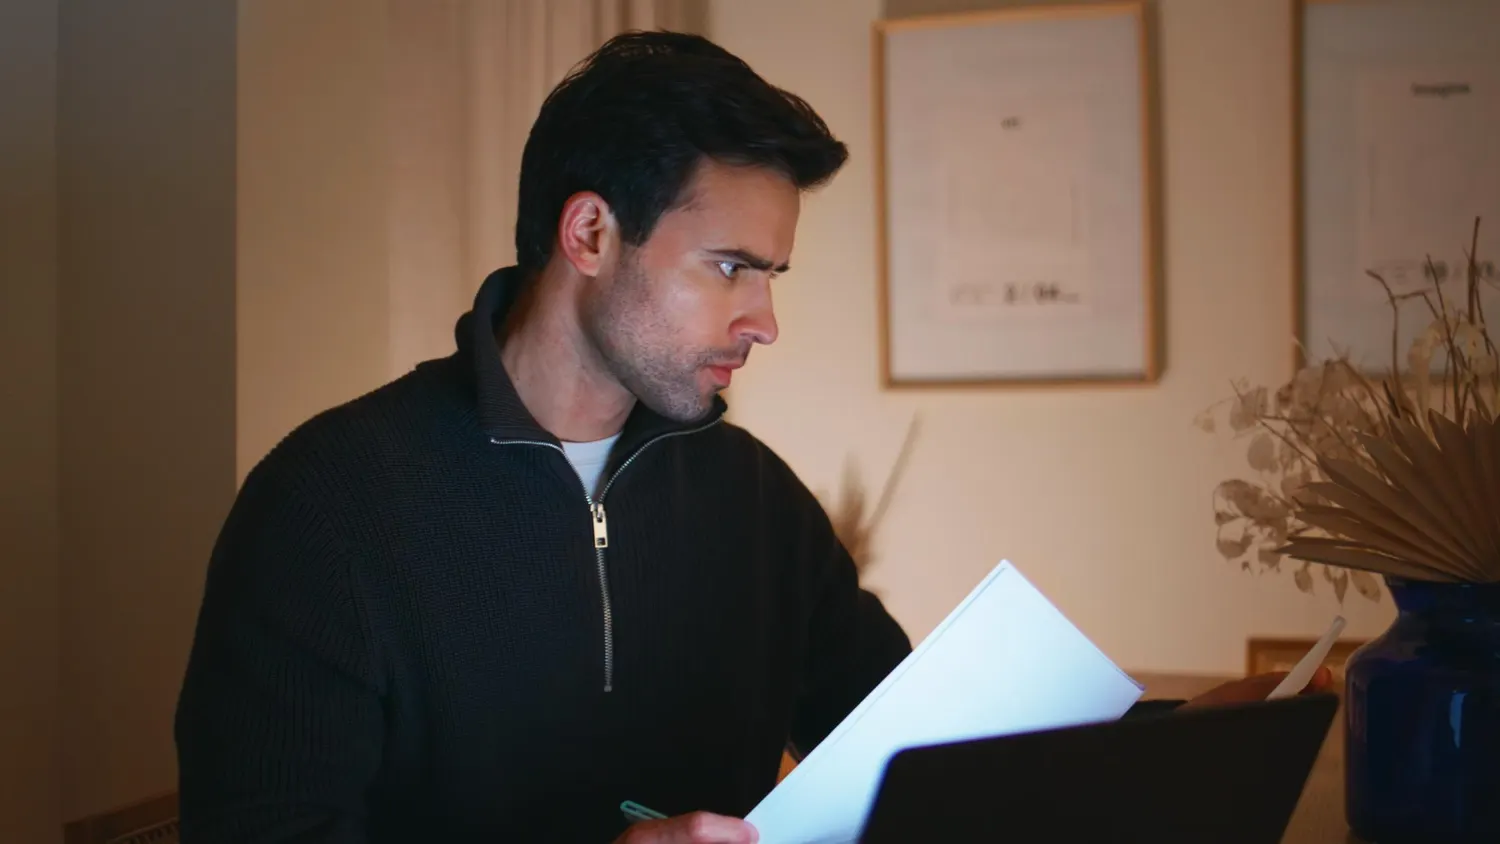
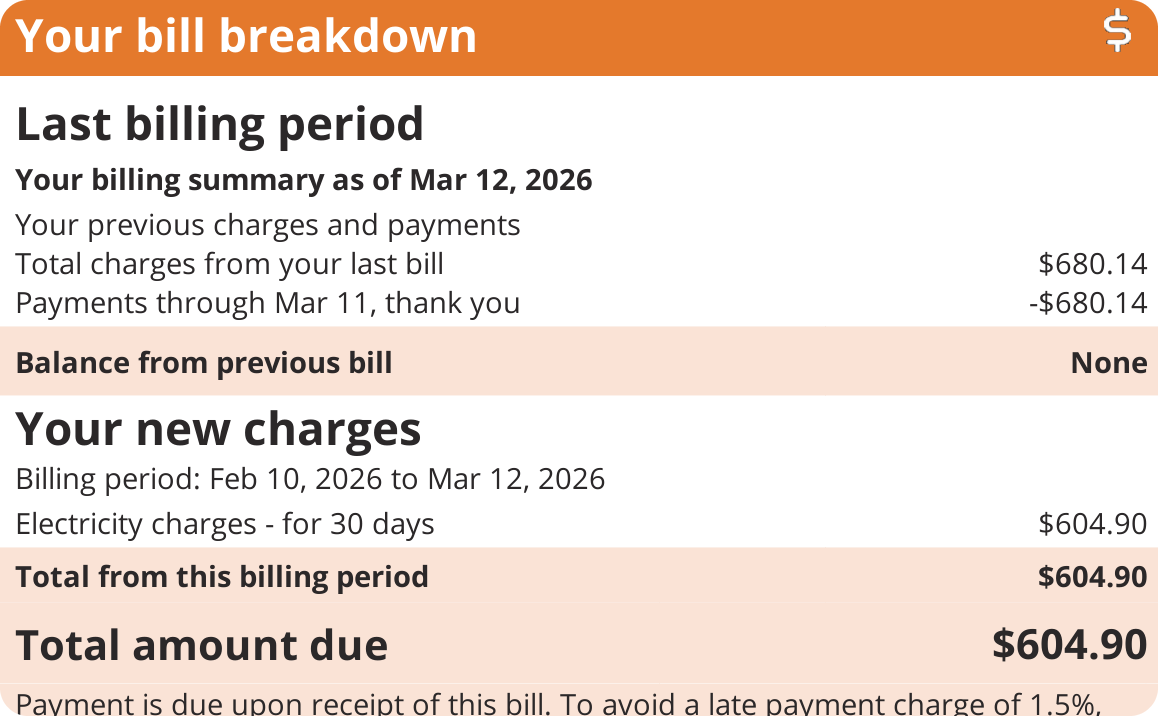
Six hundred and four dollars and ninety cents. One month, one house, electricity only, no gas mixed in. That’s a real Orange & Rockland bill sitting in front of me, and the number is high enough that “the AC ran a lot” doesn’t come close to explaining it.
So let’s explain it properly. I’m going to open this bill and account for all $604.90 of it, line by line, and by the time we’re done you’ll see that a surprising share of it isn’t about electricity at all. It’s a residential account in Middletown, billed February 10 to March 12, 2026, with 1,882 kilowatt hours used. If you’ve got your own O&R bill handy, keep it next to you, yours is built the exact same way.
How To Calculate Your Real Cost Per kWh On an O&R bill
Before we get into individual charges, here’s the one calculation worth doing on any electric bill, and almost nobody does it.
People will tell you what they pay per kilowatt hour by reading the supply rate off the bill – on this one, that’s about 18 cents. But that figure only covers the raw energy. It leaves out the entire second half of the bill and every tax and surcharge folded in. To get the number that actually hits your bank account, you divide the whole bill by the power you used:
$604.90 ÷ 1,882 kWh = roughly 32 cents per kilowatt hour.
Thirty-two cents, against a supply rate of eighteen. Nearly double. That difference – the 14 cents this homeowner is paying that they’d never have guessed – is what the rest of this article is about. Everything below is where those extra cents come from.
You can run this on your own bill in ten seconds: find “Your electricity total” and divide it by the “Total Usage” figure on page two. Whatever comes out is your true rate, and it’s almost always a lot higher than the number you’d have quoted.
Supply vs Delivery Charges on Your Orange & Rockland Bill
Page two sorts your electricity into two columns.
The supply column is the energy itself – the actual power drawn from the grid, at the going market price. O&R earns nothing on it; they buy it and hand you the cost. Here, that’s $337.64.
The delivery column is the toll for moving that energy across O&R’s poles and wires to the house. The state sets these rates through formal rate cases. Here, $267.26.
On this particular bill, supply is the larger figure, and it’s fair to point out that O&R’s supply rate this month (about 17.9 cents a kilowatt hour) ran higher than its delivery rate (about 11 cents). But supply is also the only half you have any say over. You’re allowed to buy your energy from an independent supplier instead of O&R. Delivery you’re locked into, full stop, because O&R is the only company permitted to run wires to your house. That’s why the delivery column is where we’ll spend most of our time. It’s the part you can’t negotiate, shop, or opt out of.
Orange & Rockland Delivery Charges Explained
Ten separate lines make up that $267.26. Here’s the whole column.
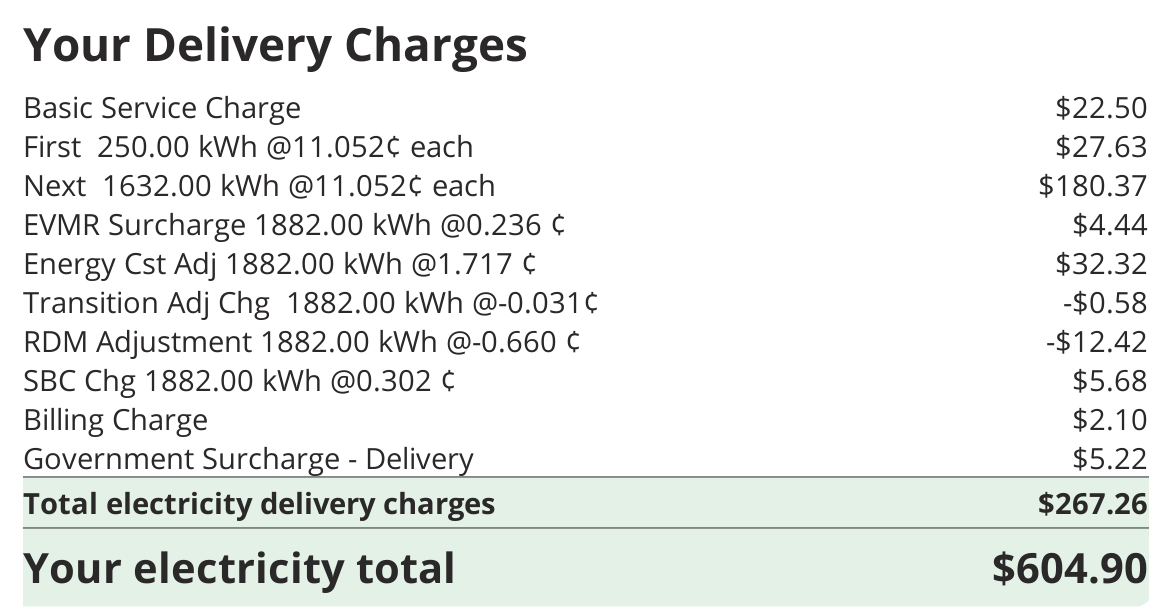
The Basic Service Charge is $22.50, and it’s the one to notice first because it’s completely detached from usage. Whether the meter spins hard or not at all, you owe this every month simply for being hooked up. It’s the number your bill can never fall below.
Then the delivery charge itself, and O&R splits it into two rungs: the first 250 kilowatt hours at 11.052¢ ($27.63), and the next 1,632 at the same 11.052¢ ($180.37). Same price per unit either way, the tiering is just how O&R formats it, but together that’s roughly $208 purely to transport the electricity. It’s the largest single component of the delivery side, and unlike the fixed charge, it climbs with every kilowatt hour that runs through the meter.
Underneath those sit the riders, and this is the part worth slowing down on, because it’s where the “why is this so high” answer really lives:
- EVMR Surcharge, $4.44 pays toward EV charging infrastructure across the territory, whether or not you drive one.
- Energy Cost Adjustment, $32.32 – a recovery charge for O&R’s older power-purchase commitments, and not a trivial one at over thirty dollars.
- Transition Adj, –$0.58 and RDM Adjustment, –$12.42 – both credits this month. The RDM (Revenue Decoupling Mechanism) squares up what O&R actually earned on delivery against what regulators allowed; it swings either way, and this month it happened to work in the homeowner’s favor.
- SBC Charge, $5.68 – a statewide clean-energy fee that funds NYSERDA programs, including the incentives that make residential solar cheaper.
- Billing Charge, $2.10 and Government Surcharge, $5.22 – the cost of cutting the bill, and pass-through taxes.
Strip the tiered delivery charge out of that list and you’re still staring at a stack of fees that exist regardless of how much power you burned. That’s the quiet engine of a high bill: not the electricity, but everything bolted to the delivery of it.
Orange & Rockland Supply Charges Explained
The supply column is the bigger dollar figure this month but a much shorter read.
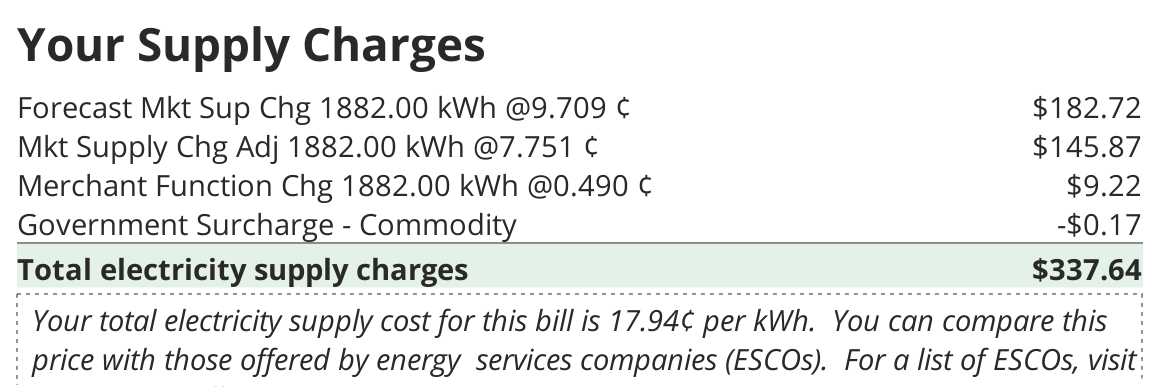
The bulk is two lines that work together: a Forecast Market Supply Charge of $182.72 and a Market Supply Charge Adjustment of $145.87. O&R estimates the price of your power up front, bills it, then reconciles against the real cost, the adjustment is that reconciliation. It rides the energy market up and down, and again, O&R takes no profit on it.
The only other real line is the Merchant Function Charge, $9.22 – essentially O&R’s handling fee for buying the energy on your behalf and carrying the credit risk. It’s the one supply charge that disappears if you move to an independent supplier.
Supply totals $337.64, and O&R helpfully prints your blended rate underneath – 17.94¢ per kWh – precisely so you can hold it up against competing offers. If you ever do shop it, go slowly on the contract: independent suppliers often lead with a teaser rate that floats upward later, and whatever you sign has zero effect on the delivery charges we just walked through.
How To Read your Orange & Rockland usage graph
Turn back to page one for a second, because there’s a chart there that explains the shape of this whole bill.
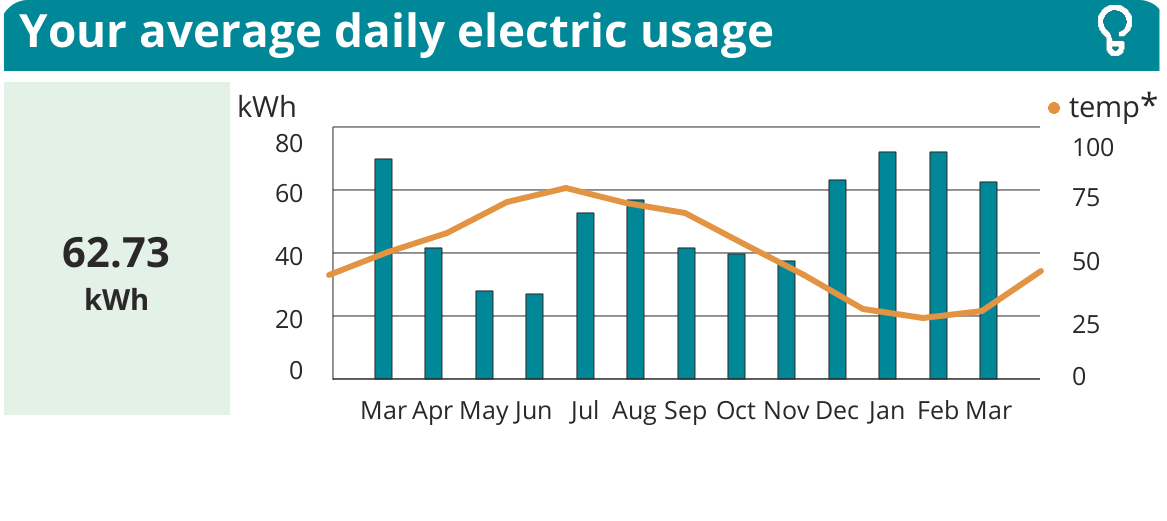
The bars are your monthly consumption; the line is the weather. When the two rise and fall together (bars spiking in the hot months, or the cold ones for an electrically heated home), it’s a tell that your bill is being run by heating and cooling rather than everyday plug load. On a $600 bill, that’s almost always the story: the HVAC system is the biggest customer in the house.
That matters beyond curiosity. Tally the twelve most recent bars and you have your true yearly consumption. It’s the single figure that determines whether solar makes sense and how big a system would need to be. Anyone quoting you off one month is guessing; a real proposal starts from a full year of this data, which you can pull straight from your O&R account.
The Orange & Rockland rate increase in 2026
None of this is holding still, either.
The state signed off on a three-year O&R delivery rate plan back in March 2025, covering 2025 through 2027. For a typical household it pencils out to increases of about 4.6% in 2025, 3.3% in 2026, and 3.5% in 2027. The 2026 rates kicked in on January 1, meaning this very bill is already running on the raised numbers.
Those percentages look gentle until you notice they don’t reset. Year two builds on year one, year three on year two, so a few “small” annual bumps compound into a delivery charge that’s meaningfully fatter by the end than it was at the start. And every one of those increases lands on delivery, the half you can’t shop away and can’t shrink by using less.
The approvals haven’t gone unchallenged. State senators from O&R’s own service area publicly ripped the decision, accusing the Public Service Commission of waving these hikes through while the utilities post comfortable profits, and pushing to restructure the PSC itself. However that political fight resolves, the effect on your statement is already scheduled: delivery goes up on a timetable, by design.
For the wider view across New York’s utilities, we laid it out here: Why New York Electric Bills Are About to Spike Again.
How to lower your Orange & Rockland bill
A few of these levers are yours to pull. The free ones come first.
O&R sets aside real money (millions under the current plan) for bill discounts to income-eligible customers through its Energy Affordability Program, and a lot of households who’d qualify never sign up. Worth two minutes to check.
If you’ve got central air, a Wi-Fi thermostat, and a compatible setup, O&R’s Smart Savers program offers a rebate that’s easy to overlook and easy to claim.
And keep an eye on the mechanics of the bill: confirm your reads say “Actual” rather than “Estimated,” and note the number of days in the cycle before you assume a jump means a rate hike. A longer month simply costs more.
But be realistic about how far any of that goes. Insulation, a smarter thermostat, tighter habits – all of it trims the kilowatt hours you buy, and that’s worth doing. It runs headfirst into the delivery column, though. The fixed charge won’t move. The surcharges won’t move. And the per-kWh delivery rate keeps ticking up every January regardless of how frugal the household gets. Conservation shaves the bill; it doesn’t change the trajectory.
Does solar make sense with Orange & Rockland?
Full disclosure, since it’s only fair: we’re a solar company. Read the following with that in mind and check it against your own numbers.
Everything above is a price that only moves one way, decided by people you’ll never meet, on a service with no alternative provider. Cutting usage changes the quantity you buy. It does nothing to the direction of the price or to the fixed charges baked into delivery.
Generating power on your roof is the one move that changes what you’re actually exposed to. A kilowatt hour you produce yourself is a kilowatt hour you’re not buying at 32 cents all-in, and not buying at whatever that figure becomes after the next scheduled increase lands, and the one after that. It won’t sever you from O&R entirely; you keep paying the Basic Service Charge. Any pitch that promises the bill goes to zero is a pitch to walk away from.
What it genuinely does is take the piece of your bill that’s climbing on a fixed schedule and swap the bulk of it for a cost you fix in place today. Whether the numbers work is entirely a function of your roof, your consumption, your shading, and the incentives you’re eligible for, which loops right back to that thirteen-month graph.
Orange & Rockland bill FAQ
Why is my Orange & Rockland electric bill so high? Two forces pile up. The supply half tracks the energy market and can spike in a given month, while the delivery half is a whole column of charges – a flat service fee, a tiered per-kWh delivery rate, and a stack of riders – most of which you pay no matter how little power you use.
Why is the delivery charge split into “First 250” and “Next” lines? O&R itemizes delivery in tiers, listing the first 250 kilowatt hours separately from everything above. On the residential rate the two tiers cost the same per unit; the split is purely how O&R presents it.
What is the EVMR surcharge on my bill? The Electric Vehicle Make-Ready surcharge, funding EV charging infrastructure across O&R’s region. It applies to every customer, EV or not.
What is the RDM adjustment? The Revenue Decoupling Mechanism. It’s a reconciliation between the delivery revenue O&R actually collected and the amount the state authorized. It lands as either a charge or a credit; on this bill, a credit.
Does switching suppliers lower the bill? It can change your supply cost and remove the Merchant Function Charge, but it leaves delivery untouched. O&R still owns the wires and still bills you to use them.
How do I calculate my real cost per kWh? Divide “Your electricity total” by the “Total Usage” in kilowatt hours, both on page two. The result runs well above the supply rate O&R prints on the bill.
See your own number
Pull your last twelve months of usage from your Orange & Rockland account and spend two minutes with the survey below. We’ll build a free savings plan showing what your roof would generate, what it would cost, and how that compares against a bill set to keep climbing through 2027 and past it.