There is a moment that happens with almost every Enphase customer within the first few days of their system getting activated. They open the app, tap over to the Array tab, and see their roof laid out on the screen with every single panel reporting its own individual production.
Although getting permission to operate from your power company is one of the most exciting moments in your solar journey, it can be equally overwhelming if you do not know how to navigate your monitoring application.
Even though our team walks you through the app when we first activate your system, this guide is worth bookmarking for whenever a question comes up down the road.
By the time you are done reading, you will know exactly what your system is doing at any moment and how to confirm everything is working the way it should.
The Four Main Tabs
One of the first things to understand about the Enphase App is how it is organized. At the bottom of the screen, you will see four tabs: Status, Energy, Array, and Menu. Each one serves a unique purpose, and once you know where to look for what, navigating the app becomes simple and seamless.
To put it simply, Status tells you what is happening, Energy tells you what happened, Array tells you which panels are doing the work, and Menu is where you go to customize everything.
The Status Tab
The Status tab is where you will spend most of your time in the app. It gives you a real-time report of your entire system, pulling together solar production, home consumption, and overproduction all in one place. It also shows your Enphase battery’s charge level if you have one.
At the top of the screen, you will see your current weather conditions and whether your system is on-grid or off-grid. Below that, you will find your net energy position for the day. This shows whether your panels are overproducing or whether you are drawing power from the grid.
This is represented by an Energy Independence or Grid Dependence score, which tells you what percentage of your home’s energy came from your solar system versus the utility.
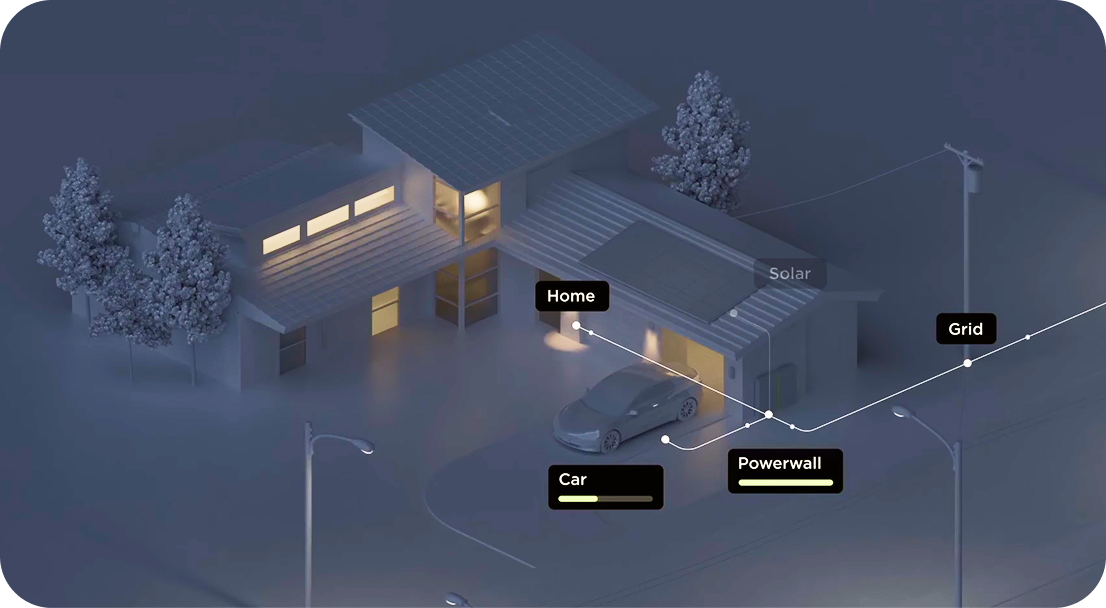
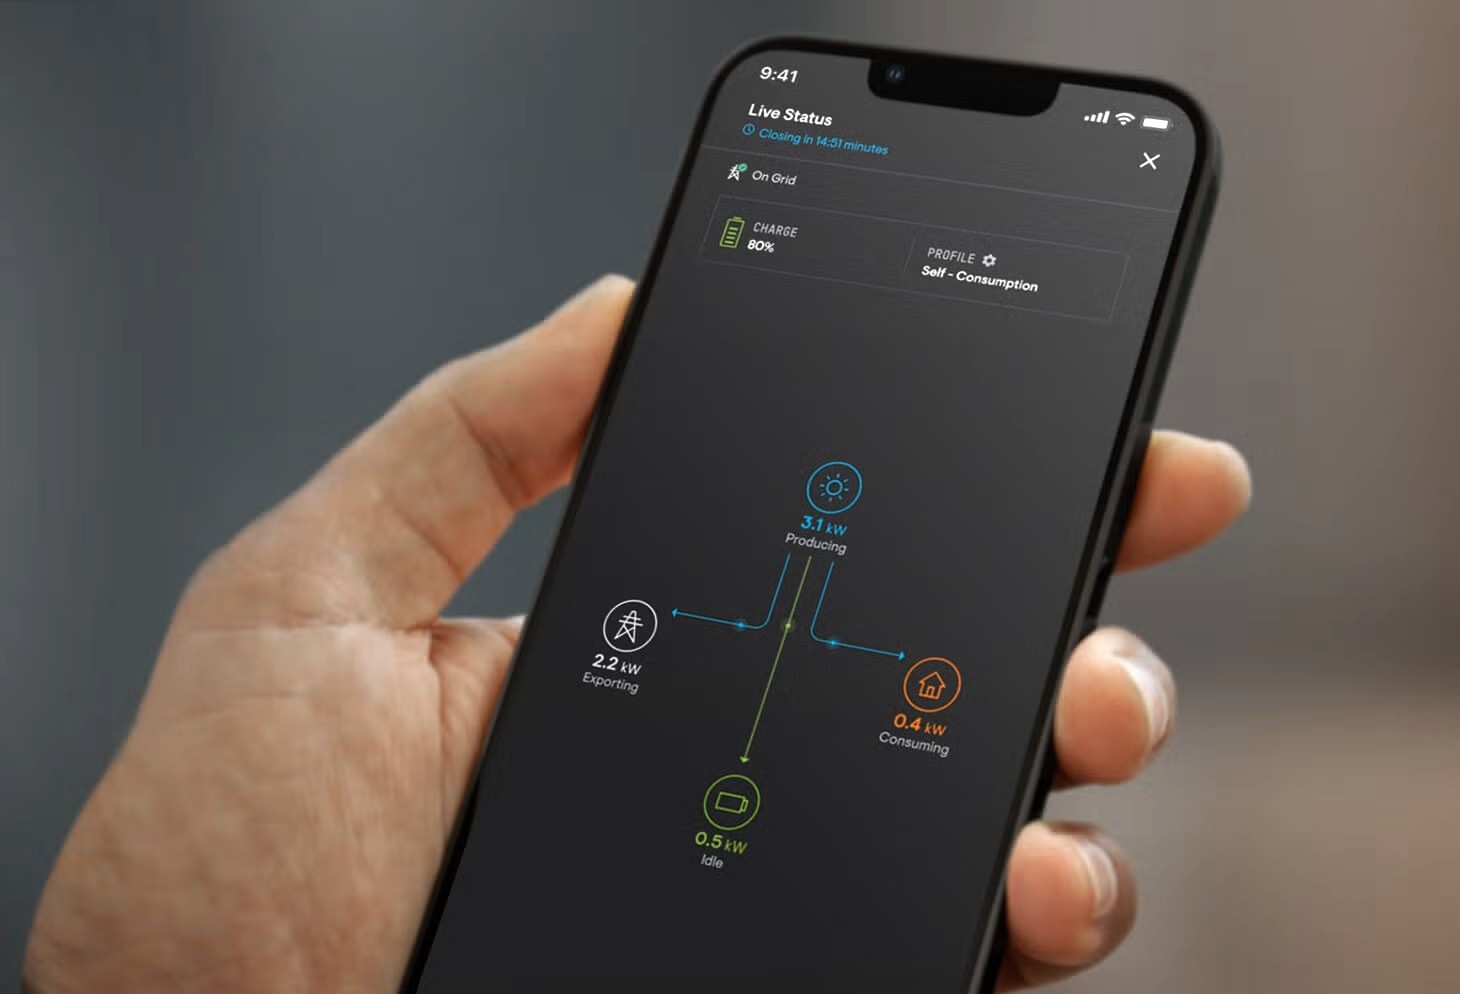
If you want real-time data down to the second, tap the Live Status button in the top right corner of the Status screen. Unlike the regular Status tab, which updates on a shorter interval, Live Status connects directly to your system and provides real-time updates of your power flow. It shows exactly when your system is drawing from solar, pulling from a battery, or drawing from the grid.
Live Status is most useful when you are running a large appliance and want to see the immediate impact on your consumption.
The Status tab gives you a real-time view of solar production, home usage, battery activity, and grid flow.
Pro Tip: Go to Menu > Settings and enter your cost per kWh so the app can start to calculate the actual dollar value of your solar production. It is one of the most satisfying numbers to watch grow over time.
The Energy Tab
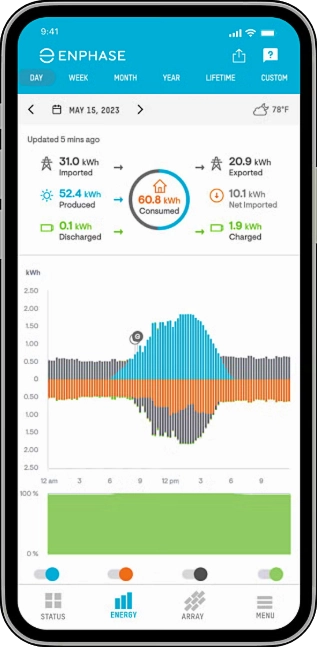
While the Status tab tells you what is happening right now, the Energy tab is where you go to understand the big picture. It shows you how your system has been performing over any period you choose. That could be a single day, a week, a month, the current year, or even the entire lifetime of your system since installation.
The graph provides details about your solar production, home consumption, and how much you send to the grid. This lets you compare each data point at the same time. You can also toggle individual data types on and off to narrow down to whatever combination you prefer, and tapping on any specific bar in the chart shows you the exact numbers for that period.
The most useful setting is that you can set a custom date range in the Energy tab that lines up with your electricity billing cycle. This makes it much easier to compare what the Enphase App is reporting against what your utility is actually billing you for the same period.
At the bottom of the Energy tab, you will also find three performance scores: Energy Independence, Grid Dependence, and Solar Offset. Each gives you a slightly different lens on how well your system is covering your home’s electricity demands.
Pro Tip: To generate a downloadable performance report for any time period, go to Menu > System > Reports. This is useful for comparing your actual annual production against the estimate your installer gave you when you signed up.
The Array Tab
This is the tab that makes Enphase monitoring genuinely different from everything else on the market, and it is one of the most overlooked features in the entire app.
Because every panel in an Enphase system has its own individual microinverter, the app can report on each panel’s performance independently. The Array tab shows you a layout that matches your physical installation on the roof, and you can tap any individual panel to see exactly how much energy it has produced for whatever time period you have selected.
Under normal conditions, all of your panels should be performing at similar levels, with small natural variation based on their position and sun exposure at any given moment. What you are really watching for is a panel that is consistently producing significantly less than the others over multiple days, or one that shows zero production on a clear sunny day.
That is usually a sign of shading from a nearby obstruction or, occasionally, a microinverter that needs attention.
The reason this matters so much is that a single underperforming panel in an Enphase system does not drag the rest of your array down with it. Each panel operates independently, so the others keep producing at full capacity even if one panel breaks down completely. But finding and addressing an issue early means you are not leaving production on the table for months without realizing it.
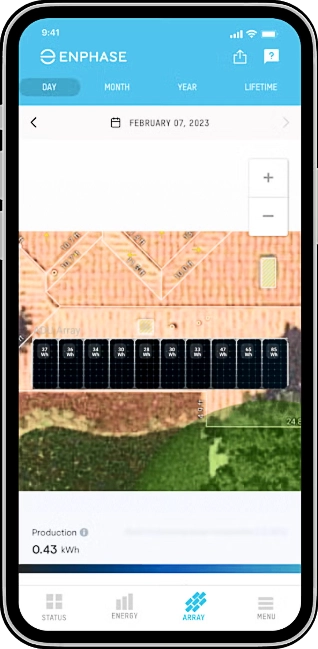
The Array tab lets you check individual panel production and spot possible issues early.
Pro Tip: Make a habit of opening the Array tab to do a quick visual check and make sure all panels are reporting normal output. It takes about 30 seconds and can catch an underperforming panel before it costs you a meaningful amount of production.
IQ Battery Profiles
If you have an Enphase IQ Battery, the profile it is running on controls how and when your battery charges and discharges, and a lot of homeowners do not know which profile their system is actually set to. You can check and change this by going to Menu > Settings > Profile in the app.
There are four main profiles to know about.
Self-Consumption
Self-Consumption stores solar energy during the day and uses it to power your home after the sun goes down, reducing how much you draw from the grid at night.
AI Optimization
AI Optimization is an intelligent mode that automatically adjusts charge and discharge decisions based on your usage patterns, solar forecasts, and electricity rates without you having to think about it.
Time-of-Use
Time-of-Use charges your battery when electricity rates are cheapest and discharges it during expensive peak-rate hours, which can be valuable if your utility has a TOU rate structure.
Full Backup
Full Backup keeps your battery 100% charged at all times and reserves it entirely for grid outages.
For most of our customers in New York, we recommend Full Backup depending on your utility rate plan. Since we have 1:1 net metering in New York, there is no need to pull from your battery unless the grid goes down.
Pro Tip: Within any profile, you can also set a reserve level under Menu > Settings > Battery. This is the minimum charge percentage your battery will always hold back for emergencies, even while operating in Self-Consumption or AI Optimization mode. A 20% reserve gives you a meaningful outage buffer without giving up too much daily performance.
Storm Guard
Storm Guard is one of the most useful features in the Enphase App, and it is one we find ourselves explaining most often to our customers because it is easy to miss if nobody tells you it is there.
Here is how it works: Storm Guard monitors the National Weather Service for severe weather alerts in your area. If a warning is issued for your location, it automatically overrides your battery profile and switches to Full Backup mode, charging your battery to 100% to make sure you have as much stored energy as possible before the storm arrives.
When the alert clears, your system returns to its normal operating profile on its own.
For New York homeowners dealing with nor’easters, ice storms, and thunderstorms, this is an extremely valuable feature. Most people do not realize their battery might only be charged up to 40% or 50% when a storm hits, which limits how long it can power your home during an outage. Storm Guard takes that variable completely out of the equation.
To enable Storm Guard, go to Menu > Settings > Profile in your Enphase App and turn Storm Guard on. Once it is active, it runs entirely in the background and handles everything automatically.
Pro Tip: Enable Storm Guard before winter. It is already built into your system and it costs you nothing. There is no reason not to have it on if you have an Enphase battery.
Final Thoughts
Once you understand how your Enphase App is organized and what each tab is showing you, it starts feeling like a real-time picture of how your investment is working for you.
If you are an Empire Solar customer and something in your Enphase App does not look right, call our team. We can access your system remotely and tell you exactly what is going on. Sometimes we can even troubleshoot your system remotely.
But if you are reading this because you are still thinking about going solar, we would love to show you what your home and savings could look like.
Want to see what solar would look like for your home?
Empire Solar has installed solar for over 7,300 New York homeowners since 2015. We are one of only 4 installers to receive NYSERDA’s Platinum Installer Award out of hundreds of companies in the state. We would be happy to show you exactly what your system would produce and what you would save over time.
Request Your Free Savings Plan