Most people look at exactly one number on their National Grid bill. The amount due. That’s understandable, because the bill is four pages long, it covers two different fuels, and it contains line items with names like “Legacy Transition Charge” and “Revenue Decoupling Mechanism.” Who cares to read that?
But if you’re in National Grid’s Upstate territory, delivery charges just went up again on April 1, 2026, and they’re scheduled to go up again in 2027. The only way to understand what’s happening to your money is to actually open the bill and read the parts underneath the total. So grab your most recent statement. We’re going to walk through it section by section, in the order it appears on the page, and explain what every charge actually is and who decided you should pay it.
The Two Halves of Every National Grid Bill
Before we go line by line, you need to understand the single most important thing about how your bill is built. Your bill is split into supply and delivery, and they are two completely different things governed by two completely different forces.
Supply is the electricity itself. The actual energy your home consumed. This price moves with the wholesale energy market, fuel prices, and demand. National Grid doesn’t profit on this portion. If you’ve switched to an ESCO (an alternate energy supplier), this is the part they bill you for.
Delivery is what it costs to move that electricity across poles, wires, and substations to your house. This is the part regulated by the New York State Public Service Commission and set through rate cases. It’s also the part that has been climbing steadily for years.
The surprising part is: delivery is usually the bigger half. For a typical Upstate residential customer, the delivery side of the bill often runs higher than the cost of the electricity itself. You can switch suppliers, shop for a better supply rate, or install every efficient appliance on the market, and you still cannot shop around for delivery. National Grid owns the wires. There is no competitor.
Keep that split in mind, because everything below hangs off it.
Section 1: Summary of Charges
At the top of the bill you’ll find your account number, service address, billing period, amount due, and due date. Underneath that is the account balance, which shows any previous balance, payments received, and the date they posted.
Then comes the Summary of Current Charges.
For most Upstate customers this section splits into four lines: electricity delivery, electricity supply, gas delivery, and gas supply. That’s it. Four numbers that add up to your total.
This is your fastest diagnostic. Before you read anything else, look at those four numbers and ask which one grew the most since last year. If your total went up and the supply lines are flat, your usage isn’t the problem. The rate structure is.
One small note on this section: if your previous bill wasn’t paid in full, you’ll see a late payment charge applied to the unpaid portion. That’s the source of the mystery “adjustment” line that confuses a lot of people.
Section 2: Meter Reading and Usage
This section is short but worth checking every single month.
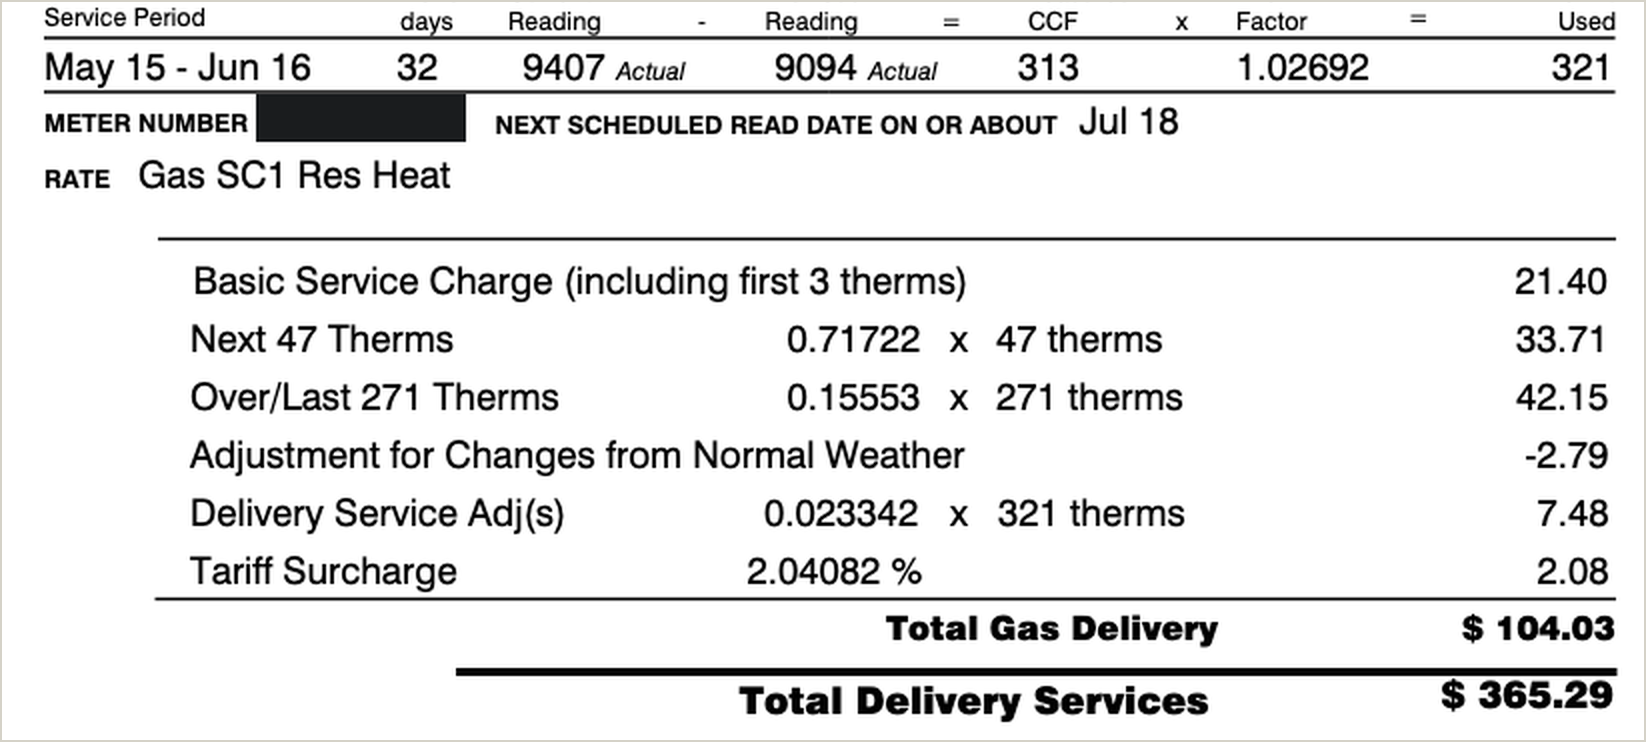
You’ll see your meter number, the previous reading, the current reading, and the difference between them, which is your kilowatt hours used for the period. You’ll also see whether the reading was actual or estimated.

An estimated reading means nobody read your meter, so National Grid projected your usage based on history. If the estimate runs high, you overpay now and get corrected later. If it runs low, you get a catch-up bill that feels like it came out of nowhere.
If you see two or three estimated reads in a row, that’s worth a phone call. You’re entitled to actual reads, and a lot of “why is my bill suddenly enormous” situations trace back to a true-up after a stretch of estimates.
Also check the number of days in the billing cycle. A 34-day cycle and a 28-day cycle are not comparable, and a lot of month-to-month “increases” are really just a longer billing period.
Section 3: Electricity Delivery Charges, Line by Line
This is the section most people scroll past, but it’s the section that explains why your bill keeps climbing. Below is what each line actually means. Prices shown are National Grid’s published SC-1 residential rates for Upstate New York, effective April 1, 2026.
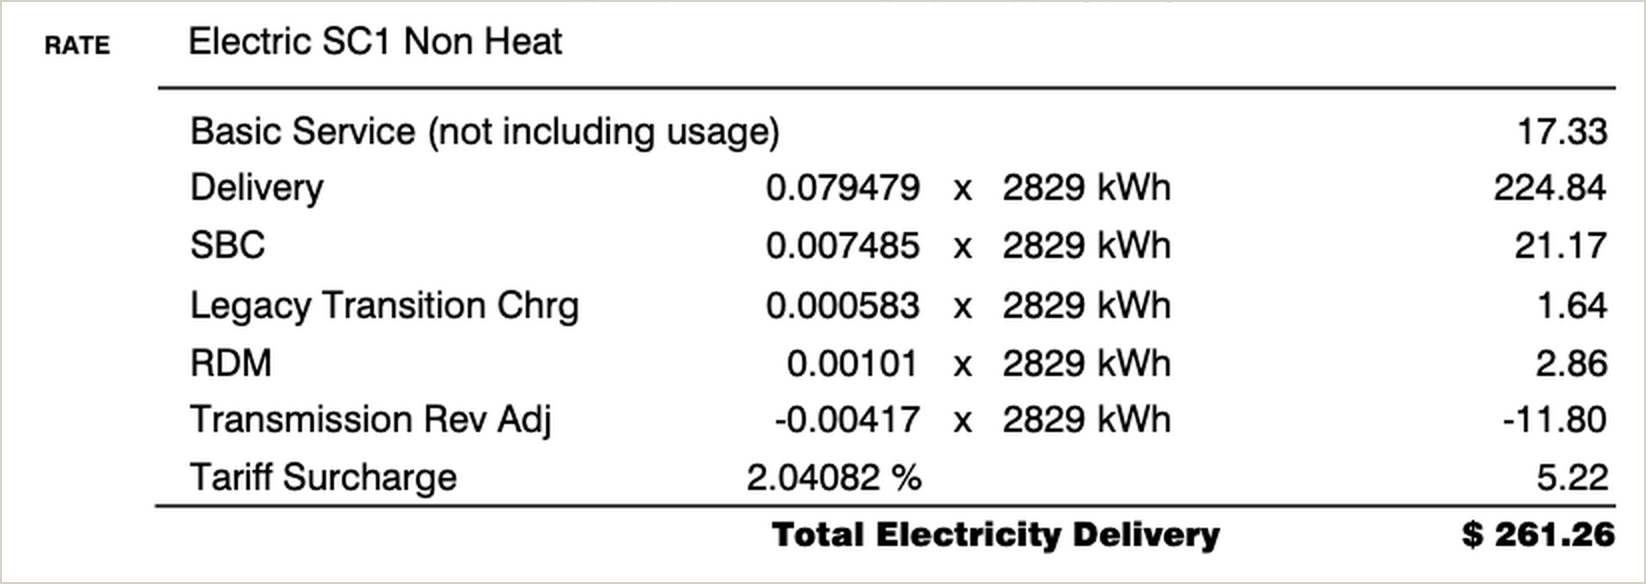
Basic Service Charge – $19.00 per month A flat monthly fee that covers meter reading, billing, equipment, and maintenance. You pay it whether you use 2,000 kilowatt hours or zero. If you go on vacation for a month and turn everything off, this charge still shows up.
Delivery Charge – 10.013¢ per kWh The per-kilowatt-hour cost of moving electricity across National Grid’s distribution system to your home. You pay this whether National Grid supplies your power or an ESCO does. This is the single largest delivery line item for most homes, and it’s the number that went up on April 1.
Legacy Transition Charge (LTC) An adjustment tied to electricity supply contracts the company entered into before June 1, 2001. For residential customers it also carries the benefit of low-cost hydropower and a Residential Consumer Discount from the New York Power Authority. Sometimes this is a charge. Sometimes it’s a credit.
System Benefits Charge (SBC) A state-mandated charge that funds public policy programs: low-income energy assistance, energy efficiency programs, and research and development including renewable energy. It’s small per kilowatt hour, but every customer in New York pays it, every month. It’s one of the funding sources behind NYSERDA’s programs, including solar incentives.
Revenue Decoupling Mechanism (RDM) This is the one that makes homeowners angriest once they understand it. The RDM compares National Grid’s actual delivery revenue against the revenue that was forecast when rates were set. If the company collects less than forecast, the difference is collected from customers. If it collects more, customers get credited. In practice, that means if everyone in your area conserves energy, the utility’s delivery revenue is still protected. This is why “just use less” has become a weaker strategy than it used to be.
Transmission Revenue Adjustment (TRA) The same idea as the RDM, but for transmission service revenue, reconciled monthly.
Rate Adjustment Mechanism (RAM), Earnings Adjustment Mechanism, and Temporary Deferral Recovery Surcharge Reconciliation and deferral recovery mechanisms. These true up the difference between what was forecast in the rate case and what actually happened.
Clean Energy Standard Delivery (CESD) Recovery of costs tied to New York’s Clean Energy Standard on the delivery side.
Arrears Management Program (AMP) Funds a program that helps eligible low-income customers reduce past-due balances.
Electric Vehicle Make-Ready (EVMR) Funds the infrastructure buildout for EV charging across the service territory.
Energy Storage Surcharge (ESS) Funds energy storage program costs approved by the Commission.
Value of Distributed Energy Resources (VDER) The mechanism that governs how distributed generation, including rooftop solar, is compensated. Varies monthly.
Dynamic Load Management Surcharge Recovers the cost of demand response programs that keep the grid reliable during peak periods.
Notice something about that list. Almost none of those charges are about the electricity you used. They’re about programs, reconciliations, and infrastructure. And they’re all on the half of the bill you cannot shop around for.
Section 4: Electricity Supply Charges
This section is shorter, and it’s the half of your bill that reflects actual energy.
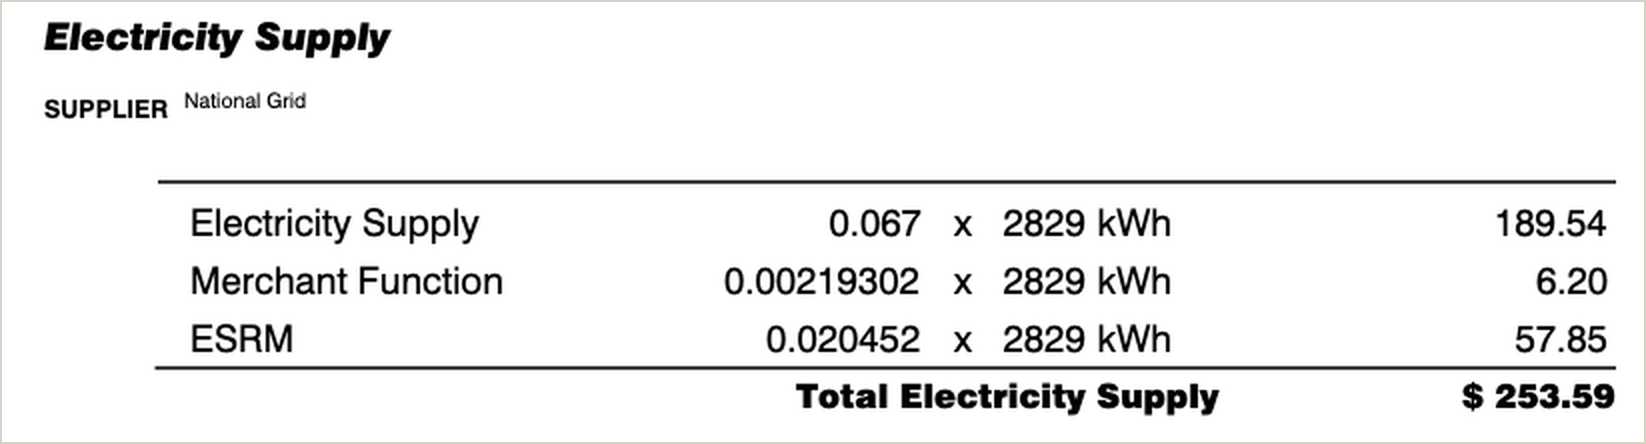
Electricity Supply Charge The market cost of the electricity you used. It varies by month and by load zone, and it moves with fuel prices, weather, and demand. National Grid does not earn a profit on this portion. If you have an ESCO, this line reflects your contract price with them instead.
Merchant Function Charge The cost National Grid incurs to procure energy supply on your behalf. This charge only applies if National Grid is your supplier. If you switch to an ESCO, it drops off.
Electricity Supply Reconciliation Mechanism (ESRM) Reconciles supply revenue against the actual market cost of electricity purchased during the month. Costs above revenue get collected. Revenue above cost gets credited. For most residential customers this also includes the cost or benefit of hedging contracts.
Clean Energy Standard Supply (CESS) Recovery of Clean Energy Standard costs on the supply side.
Customer Service Credit A credit applied to customers who use an alternate supplier rather than National Grid.
Section 5: Taxes and State Surcharges
Two things show up down here:
Sales tax is applied to your energy charges at your local rate, which varies by county and municipality.
The Incremental State Assessment Surcharge, sometimes labeled as a temporary state surcharge, recovers the Temporary State Energy and Utility Service Conservation Assessment under Public Service Law §18-a. It has been on New York utility bills for years, which is a useful reminder about how the word “temporary” works in utility billing.
And if you have gas service with National Grid, you’ll see a parallel structure on the gas side: a Basic Service Charge that covers the first three therms or less at $23.75, then a rate for the next 47 therms, then a lower rate above 50 therms, plus a Gas Supply charge and a Merchant Function Charge. Same architecture, different fuel.
Section 6: The 13-Month Usage Graph
In the sidebar of your bill there’s a bar graph showing your usage over the last 13 months. This is the most useful thing on the entire statement and almost nobody uses it.
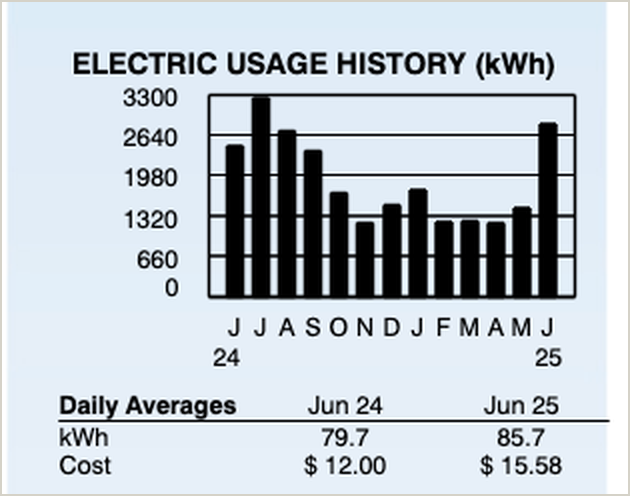
Add up the last 12 bars. That’s your annual kilowatt hour consumption. That single number tells you more about your energy situation than any monthly bill ever will, because it smooths out weather, billing cycle length, and seasonal swings. It’s also the number any legitimate solar company will ask you for first. A quote built on one summer bill is a guess. A quote built on twelve months of real data is a design.
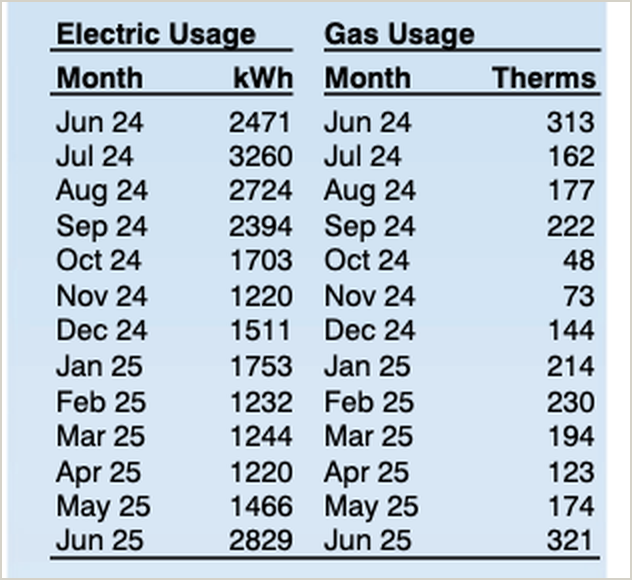
While you’re looking at it, notice the shape. If your tallest bars are July and August, you’re cooling-driven. If they’re January and February, you’re heating-driven, which usually means electric heat, a heat pump, or a well pump working overtime in the cold.
What You’re Actually Paying Per Kilowatt Hour
Almost everyone who tries to calculate their electric rate does it wrong. They take the supply charge, divide by kilowatt hours, and get a number that looks reasonable. But that’s only the cost of the energy. It ignores the larger half of the bill.
Your real cost per kilowatt hour is the total of everything, divided by the kilowatt hours you used.
Let’s run it on a sample month. National Grid uses 625 kWh as a typical residential usage benchmark in its Upstate rate filings, so we’ll use that, with the company’s published April 2026 rates.
| Basic Service Charge | $19.00 |
| Delivery Charge (625 × 10.013¢) | $62.58 |
| Delivery surcharges and riders | ~$9.42 |
| Total Delivery | ~$91.00 |
| Electricity Supply | ~$48.75 |
| Merchant Function Charge, ESRM, CESS | ~$3.25 |
| Total Supply | ~$52.00 |
| Sales tax and state assessment | ~$5.72 |
| Total Bill | ~$148.72 |
Now do the two different math problems.
Supply only: $52.00 ÷ 625 kWh = 8.3¢ per kWh
Actual, all-in: $148.72 ÷ 625 kWh = 23.8¢ per kWh
The electricity itself cost about eight cents. You paid closer to twenty-four.
That gap is the entire point of this article. When someone tells you electricity in New York costs a certain amount, they’re almost always quoting the supply number. Your household budget doesn’t care about the supply number. It cares about the total.
Now extend it. At 625 kWh a month, that’s 7,500 kWh a year and roughly $1,785 a year in electricity. If rates rise 4% a year, which is conservative given what’s actually been approved recently, that same household spends around $100,000 on electricity over a 30-year mortgage. And if you heat with electricity, run a heat pump, or charge an EV, your usage isn’t 625 kWh a month. It’s two or three times that, and so is the number at the end.
(Run the math on your own bill: take your total amount due, subtract any past-due balance, and divide by the kWh shown in your meter reading section. That’s your real rate.)
What Changed on April 1, 2026
In August 2025, the New York State Public Service Commission approved a three-year electric and gas delivery rate plan for National Grid’s Upstate territory. It was a joint proposal signed by fifteen parties, including the company, Department of Public Service staff, consumer advocates, labor groups, and large industrial customers.
Worth noting for fairness: the Commission substantially cut what National Grid originally asked for, reducing the requested first-year electric delivery revenue by over $340 million and gas delivery revenue by nearly $100 million.
April 1, 2026 was phase two of that plan. Electric delivery charges rose approximately 7.3% and gas delivery charges rose approximately 11.7%. Estimates put the combined impact at roughly $15 a month for an average household. This is not a one-time increase that lands and fades. Each phase becomes the baseline for the next one. You don’t return to the old rate. You start the next step from the higher number.
What’s Coming in April 2027
Phase three of the plan is scheduled for April 1, 2027.
Based on the approved joint proposal, a residential customer using around 625 kWh of electricity and 78 therms of gas per month is looking at another increase in the range of $13 to $14 a month across both fuels in the final year. Add up all three phases and the average Upstate National Grid household is paying meaningfully more for the same service than they were in the summer of 2025.
There’s also a larger conversation happening in Albany right now. In early 2026, Governor Hochul announced a ratepayer protection plan and a PSC proceeding partly focused on whether large-load users, including data centers, are paying their fair share of the infrastructure they require.
What You Can Actually Control
So what do you do with all this? Start with the things that cost nothing.
Check whether you’re eligible for the Energy Affordability Program or an income-eligible Basic Service Credit. National Grid’s approved rate plan includes more than $290 million in bill discounts for vulnerable Upstate customers over the three years, and a lot of eligible households never enroll.
Look at whether the Voluntary Time-of-Use rate makes sense for you. Off-peak delivery on that rate is dramatically cheaper than on-peak, but it only works if you can genuinely shift laundry, dishwashing, and EV charging to overnight hours. For most households it’s a small win. For an EV owner who charges at home, it can be a real one.
Verify your meter reads are actual, not estimated. Compare your billing cycle length before you panic about a jump. Then be honest about the limits.
Efficiency still matters. Better insulation, a smarter thermostat, and efficient appliances all reduce the kilowatt hours you buy. But look back at that delivery section. The Basic Service Charge doesn’t move when you use less. The surcharges are per-kilowatt-hour but small relative to the fixed structure. And the Revenue Decoupling Mechanism exists specifically to protect the utility’s delivery revenue when customers conserve.
Where Solar Actually Fits Into This
We install solar. So take this section with whatever grain of salt you think it deserves, and check the math yourself against your own bill.
Here’s the argument. Everything above describes a cost structure moving in one direction, set by a process you don’t participate in, on a service you can’t buy from anyone else. Efficiency reduces how much of it you buy. It doesn’t change the direction.
Producing power at your own home changes what you’re exposed to. Every kilowatt hour your roof generates is a kilowatt hour you’re not buying at 23.8 cents, and not buying at whatever the number is after the 2027 phase, and the phase after that. It doesn’t eliminate your relationship with National Grid. You’ll still have a meter, you’ll still have a Basic Service Charge, and you’ll still be connected to the grid for the hours your system isn’t producing. Anyone who tells you solar makes your electric bill disappear entirely is overselling it. What it does is take the largest, fastest-growing line in your household energy budget and replace most of it with a cost you know in advance.
The math either works for your house or it doesn’t, and that depends on your roof, your usage, your shading, and your incentives. Which brings us back to that 13-month usage graph.
Common Questions About National Grid Bills
Why is my delivery charge higher than my supply charge? Because delivery covers the fixed cost of the entire distribution system, not the energy itself. It includes the Basic Service Charge, the per-kWh delivery rate, and more than a dozen state-mandated programs and reconciliation mechanisms. For most Upstate residential customers, delivery is the larger half of the bill.
Can I avoid National Grid’s delivery charges by switching suppliers? No. Switching to an ESCO changes who bills you for supply and removes the Merchant Function Charge. Delivery charges stay exactly the same, because National Grid still owns and operates the wires.
What is the SBC charge on my National Grid bill? The System Benefits Charge is a state-mandated fee funding low-income energy assistance, efficiency programs, and clean energy research and development. It’s collected by National Grid but doesn’t pay for your electricity.
What is the Revenue Decoupling Mechanism? A mechanism that compares National Grid’s actual delivery revenue to the amount forecast when rates were set. Shortfalls are collected from customers; excess is credited back. It’s the reason conservation alone doesn’t reduce utility delivery revenue the way people expect.
Why did my bill go up when my usage went down? Usually one of three things: the April 2026 delivery increase, a longer billing cycle, or a correction following estimated meter reads. Check the meter reading section for the word “estimated” and compare the number of days in the cycle.
How do I calculate my real cost per kWh? Take your total current charges, including delivery, supply, and taxes, and divide by the kilowatt hours in your meter reading section. Most Upstate homeowners land meaningfully higher than they expected.
Check How Much You Can Save
Pull up your last twelve months of usage in your National Grid account and take two minutes with the survey below. We’ll build you a free savings plan showing exactly what your home would produce, what it would cost, and what the numbers look like against a bill that’s scheduled to increase again next April.